Are you plagued by errors in your Python code?
"I don't know where it stopped." "It's a pain to check the printout."
The solution to such problems isVSCode debugging featuresis.
This guide will help you get started quickly even if you are a beginner.
How to debug Python in VSCodeFully explained with code.
From convenient usage to error handling,A configuration that anyone can easily recreateWe will introduce it in.
What is the debug feature?
Conclusion: You can stop the program in progress and check it.
When writing a program, there are many times when you feel like "for some reason, it's not working the way I expected."
In such a case, useDebugging FeaturesVSCode makes this easy.
What you can do
- You can stop the program at any line and check the contents.
- Display variable contents in real time
- You can execute the process line by line.
- You can easily follow the flow of the function.
The appeal of this is that you can visualize the operation of a program without having to write many lines of print statements.
Preparing for debugging Python
Conclusion: Just install VSCode and the Python extension.
To debug Python, you need the following:
What you need
- VSCode (Visual Studio Code)
- Python (3.x series)
- VSCode's "Python" extension
How to add extensions
- Launch VSCode
- Click the square mark (extension) on the left menu
- Enter "Python" in the search box.
- "Install" Microsoft extensions
That's it, preparation is complete.
How to use breakpoints
Conclusion: Just click to the left of the line you want to stop
A breakpoint is a location where a program will pause.
How to use steps
- Opening a Python file in VSCode
- On the line you want to stopMargin to the left of line numbersClick
- A red circle means that a breakpoint has been set.
After that, run the program by clicking the "Run and Debug" ▶️ mark and it will stop at the specified point.
A working debug example (with code)
Conclusion: You can trace the functions and processes that are likely to cause errors line by line.
1 | def divide_numbers(a, b): result = a / b return result x = 10 y = 0 # An error occurs here answer = divide_numbers(x, y) print(answer) |
How to proceed with debugging
result = a / bSet a breakpoint at- variable
aandbCheck the value of - It is possible to stop and deal with the exception (ZeroDivisionError) before it occurs.
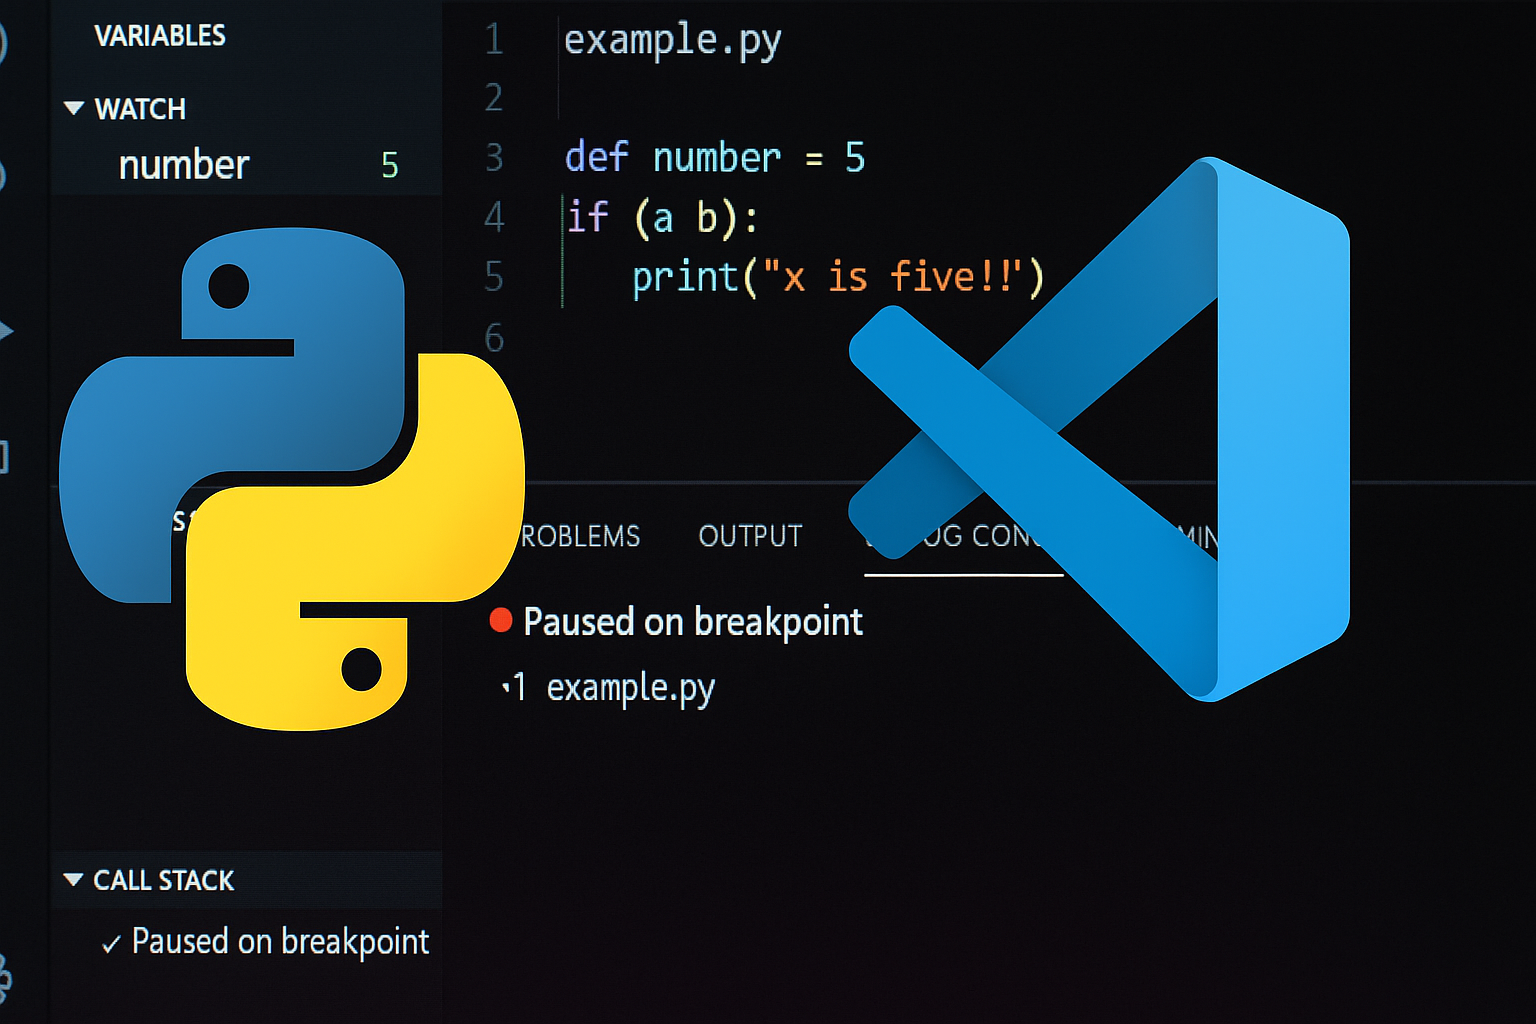
What you can see on the screen
- Variables list (Variables panel at the top left)
- Call stack
- Highlight execution stop position
- Evaluating any expression in the console (watch function)
Common errors and solutions
Conclusion: Be careful with launch config files and environment selection
Cases where the device cannot start
"launch.json"If it doesn't exist, debugging won't start.
→F5You can generate it automatically by pressing
Python doesn't run
- The correct interpreter may not be selected.
→ You can select it from "Python" at the bottom right of the screen.
Breakpoints don't work
- The executable file and the edit file may not match.
→ Force the changes to be reflected by clicking "Save file" in the upper left corner of VSCode
Why Debugging is Needed
Conclusion: Being able to debug can dramatically change the speed of growth
Many of the problems that beginners encounter are due to them continuing on without understanding the cause.
Using VSCode's debugging features gives you the following powers:
- Ability to correctly understand processing flow
- Ability to independently discover the cause of an error
- Ability to solve problems with confidence
If you are serious about learning Python, get into the habit of checking with debug instead of print.
Summary and sample configuration
Conclusion: Mastering VSCode will greatly improve your Python skills
- Python beginners should use the debugging feature early on.
- Visualize the process flow with breakpoints
- Checking each line makes errors less scary
Full code for practice (copy and paste will work)
1 | def greet(name): message = f"Hello, {name}!" return message def add(a, b): total = a + b return total def main(): name = "Taro" print(greet(name)) x = 5 y = 3 print(f"{x} + {y} = {add(x, y)}") if __name__ == "__main__": main() |
Open this code,Breakpoints in any functionPlease set it and try it.