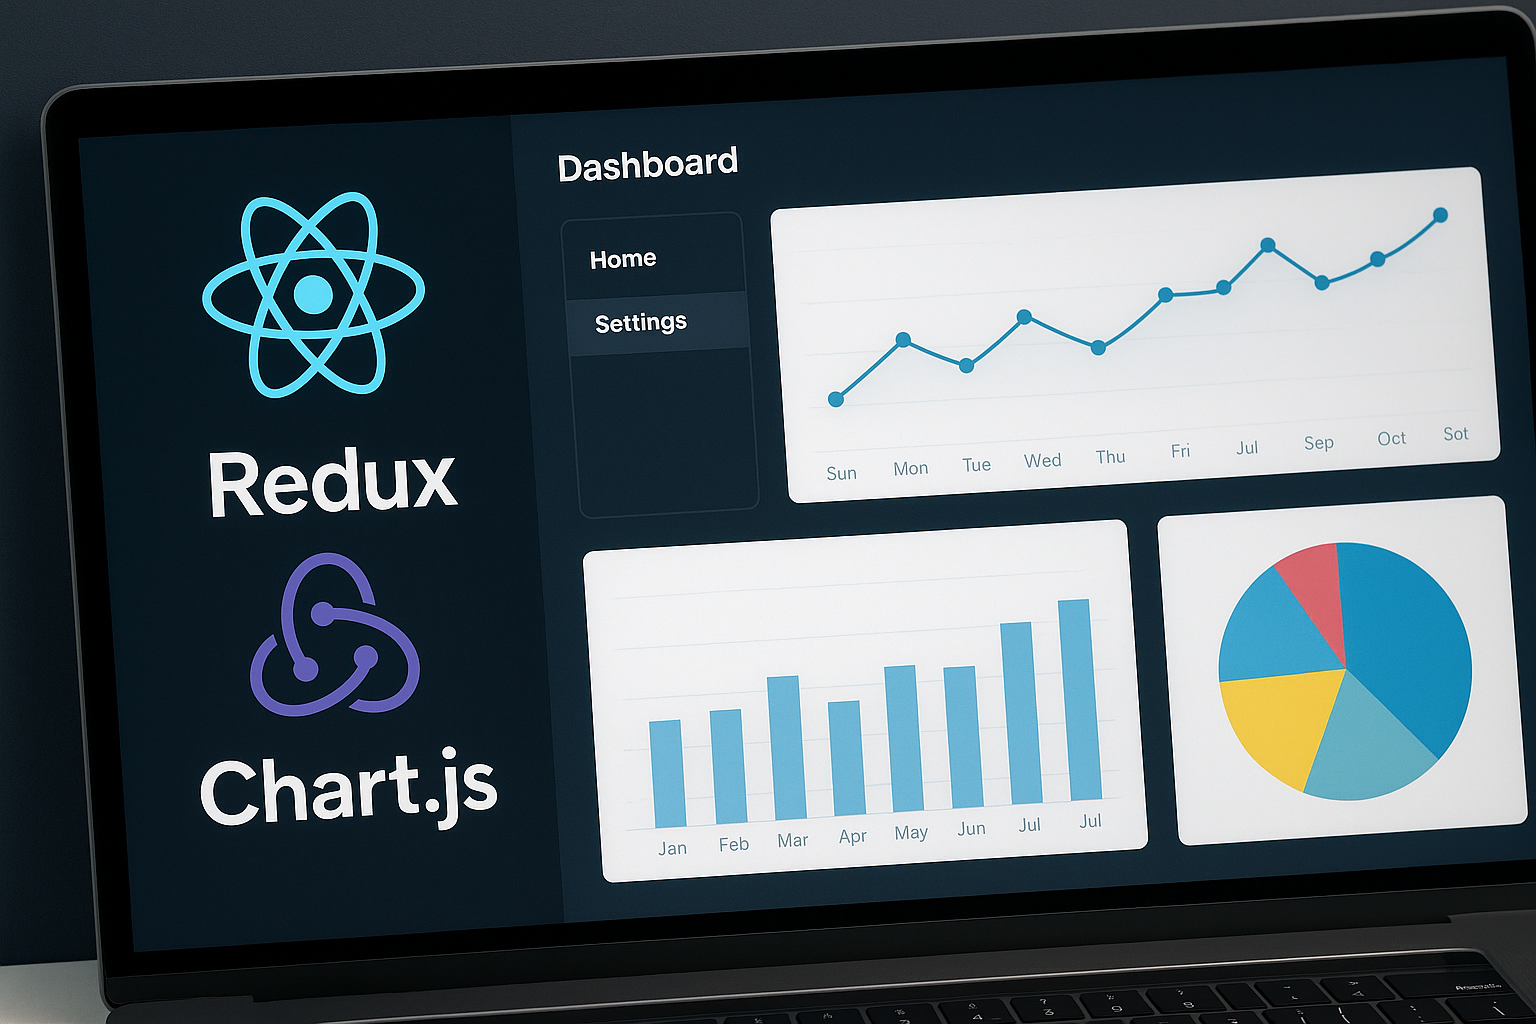
"I want to manage and visualize data using React, but I don't know where to start."
Do you think state management and graph display are difficult?
actually,By combining React, Redux, and Chart.js, anyone can easily create an admin dashboard.
In this article,A detailed explanation of data acquisition, state management, graph drawing, and screen configurationI will.
It is structured with examples that are easy to understand even for beginners, and includes code that can be used immediately.
Why build a dashboard with React?
Why are dashboards important?
Conclusion: Having a system that allows you to grasp information at a glance is necessary in every situation.
In modern business, data visualization is important. For example:
- Understanding business conditions (sales and profit trends)
- Learning management (analysis of study time and learning progress)
- System monitoring (server operation status and number of accesses)
- Improved efficiency of inventory and customer management
The Ministry of Economy, Trade and Industry also"Management support through data utilization"is at the core of the DX promotion policy (Reference: https://www.meti.go.jp/policy/it_policy/dx/index.html).
By using React,A beautiful UI that updates data in real timecan be constructed efficiently.
Understanding the role of Redux and Chart.js
How to manage state with Redux?
Conclusion: It is convenient to centralize data shared across multiple screens or components using Redux.
The following types of data are best managed with Redux:
- User Information
- Numbers and statistics
- Filter Criteria
- What to display on the graph
1 | npm install redux react-redux |
What can you do with Chart.js?
Conclusion: You can easily display bar graphs, line graphs, pie charts, etc.
Chart.js is useful for the following reasons:
- Lightweight and fast loading
- A wide variety of graphs
- Free to customize the design
1 | npm install chart.js react-chartjs-2 |
Screen composition and design basics
Dashboard layout design
Conclusion: Depending on the purpose of data display, a combination of "cards + graphs" can be effective.
Example configuration:
- Header (app name, logout button)
- Side menu (switching function)
- Main Area:
- Overall indicators (sales, number of users, etc.)
- Graph display (line and pie chart)
- Update date/filter
1 2 3 4 5 6 7 8 | function Dashboard() { return ( <div classname="dashboard"> <header /> <sidebar /> <maincontent /> </div> );} |
How to manage data with Redux
Designing and Manipulating Global State
Conclusion: Using slices to organize things by management targets makes them easier to handle.
1 | // store.js import { configureStore } from '@reduxjs/toolkit'; import dataReducer from './dataSlice'; export const store = configureStore({ reducer: { data: dataReducer, }, }); |
1 | // dataSlice.js import { createSlice } from '@reduxjs/toolkit'; const initialState = { sales: [12, 19, 3, 5, 2, 3], labels: ['January', 'February', 'March', 'April', 'May', 'June'], }; export const dataSlice = createSlice({ name: 'data', initialState, reducers: { updateSales: (state, action) => { state.sales = action.payload; }, }, }); export const { updateSales } = dataSlice.actions; export default dataSlice.reducer; |
How to display a chart with Chart.js
Let's implement drawing a bar graph
Conclusion: Use Selector to get the Redux value and pass it to Chart.js to easily display a graph.
1 | import { Bar } from 'react-chartjs-2'; import { useSelector } from 'react-redux'; function SalesChart() { const sales = useSelector((state) => state.data.sales); const labels = useSelector((state) => state.data.labels); const data = { labels: labels, datasets: [ { label: 'Monthly sales', data: sales, Color: 'rgba(75,192,192,0.6)', }, ], }; return ; } |
Points for improvement and advanced usage
How can we make our dashboards more actionable?
Improvements such as the following can make it a production-level tool:
- Dynamic data retrieval from APIs (using axios or fetch)
- Date filters and item switching
- Theme switching (dark mode supported)
- Database integration (Firebase, Supabase)
Overall structure of the completed code
App.js
1 | import React from 'react'; import { Provider } from 'react-redux'; import { store } from './store'; import Dashboard from './Dashboard'; function App() { return ( ); } |
Dashboard.js (Layout)
1 2 3 4 5 6 7 | import SalesChart from './SalesChart'; function Dashboard() { return ( <div> <h2>Sales Dashboard</h2> <saleschart /> </div> );} |
summary
In this article, we will combine React, Redux, and Chart.js toA dashboard management tool that anyone can useWe explained how to create it.
Key points to note are:
- By managing the state collectively with ReduxEnsure data consistency
- With Chart.jsImplemented graph display function that anyone can use
- ReactHighly maintainable and scalable dashboards can be easily constructed
This is a useful skill in the workplace, so be sure to try learning it by working on code.


